

You Are Here
I have always loved how information is communicated through charts, graphs, diagrams, and maps. Information Visualization was one of my favorite Special Topics courses to teach. During one year the group project was to create a timeline tracking significant milestones in the university’s history. Over the semester, students researched and gathered information to contribute to the piece.
When UWSP celebrated its 125th anniversary, the timeline was amended, revised, and printed for installation in a gallery exhibit.

You are here — 1894-1930

You are here — 1930-1970
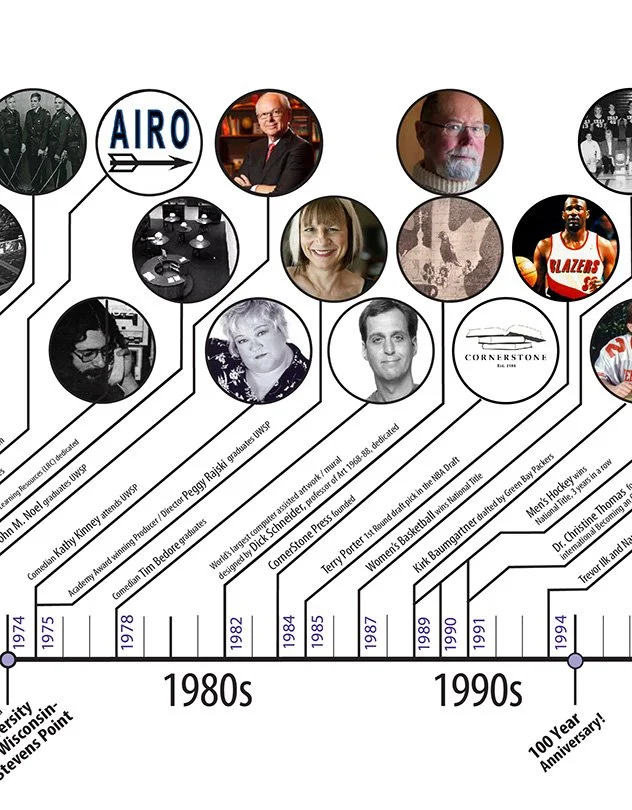
You are here — 1970-1990
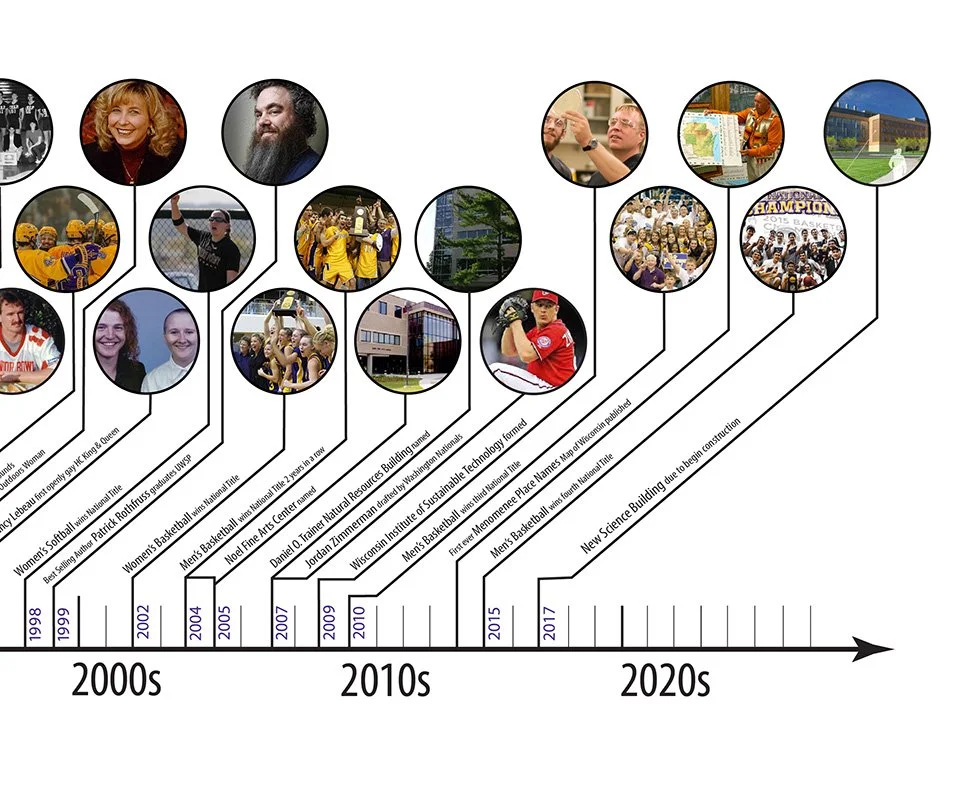
You are here — 1990-2017
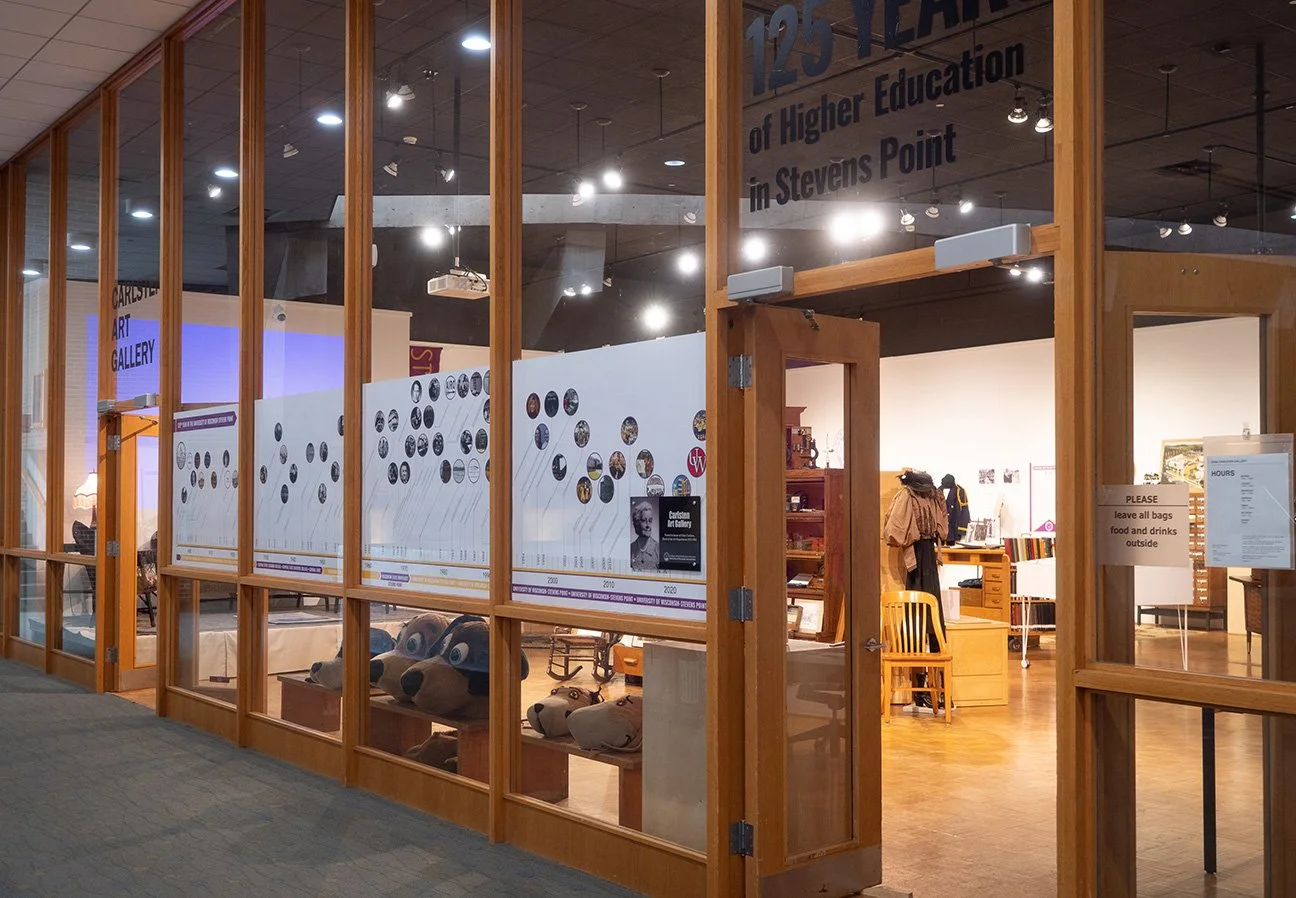
View of gallery installation in the Edna Carlsten Art Gallery.